tlpipe.plot.plot_slice
Plot time or frequency slices.
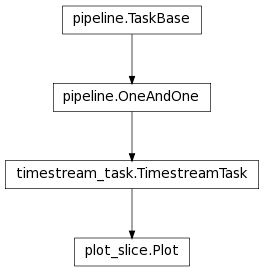
Inheritance diagram
Functions
output_path(path[, relative, mkdir, iteration]) |
Normalize the given output path. |
Classes
AutoMinorLocator([n]) |
Dynamically find minor tick positions based on the positions of major ticks. |
MaxNLocator(\*args, \*\*kwargs) |
Select no more than N intervals at nice locations. |
Plot([parameter_file_or_dict, feedback]) |
Plot time or frequency slices. |
RawTimestream([files, mode, start, stop, ...]) |
Container class for the raw timestream data. |
Timestream([files, mode, start, stop, ...]) |
Container class for the timestream data. |
datetime(year, month, day[, hour[, minute[, ...) |
The year, month and day arguments are required. |